
The short answer
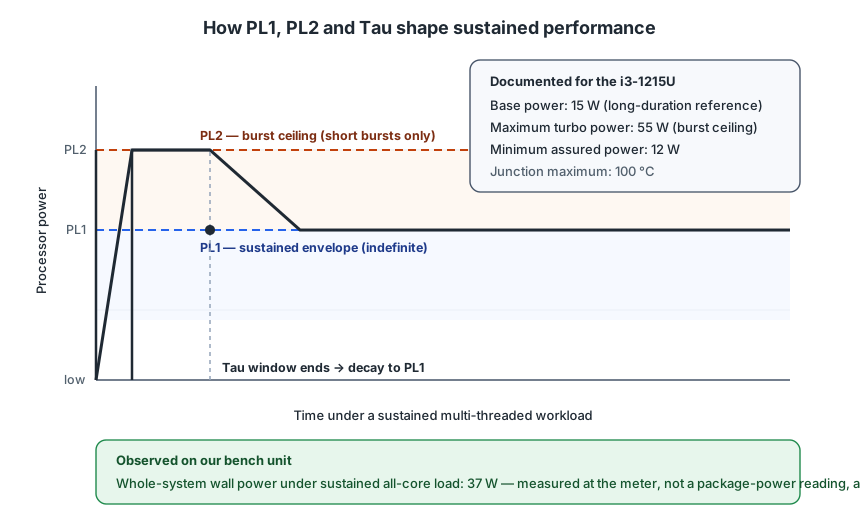
PL1 is the power a processor may sustain indefinitely; PL2 is a higher ceiling allowed only for a bounded window, after which power must fall back to PL1. A mini PC that feels slow while staying cool is usually hitting PL1, not a thermal limit — and the two look nothing alike once you measure them.
What we measured on our unit
We only publish first-hand figures for the machine on our bench: a Beelink EQi12 with an Intel Core i3-1215U, BIOS EQI12D405.
| State | Wall reading | How the state was verified |
|---|---|---|
| Startup | 23 W | Power-on sequence observed |
| Windows idle | 14 W | Docker fully stopped |
| Docker stack idle | 12 W | Jellyfin, PostgreSQL, nginx and Redis healthy |
| Sustained CPU load | 37 W | All eight logical processors at 100% |
| Jellyfin QSV transcode | 13 W | h264_qsv and vpp_qsv confirmed in the log |
| S3 sleep | 1 W | Suspend event succeeded |
| Normal shutdown | 1 W | Windows shutdown completed |
Three things about that table, stated plainly because this is where power-limit articles usually mislead:
- These are whole-system wall readings, taken with a meter between AC power and the machine. They include the power supply’s conversion loss, memory, NVMe storage, networking and the operating system. They are not package power and they are not PL1 or PL2 values.
- The 37 W load figure does not tell us the package is at its ceiling. Intel documents 55 W maximum turbo power for this processor. A whole-system reading of 37 W under sustained all-core load is well below what a package sitting at that burst ceiling would imply, but we did not instrument package power, so the two cannot be separated from this data.
- We did not change PL1 or PL2 on this unit. Nothing on this page is a measured before-and-after of a power-limit adjustment, because we have not run that experiment. Everything below that is not our own wall reading is attributed to the sources at the end.
What the silicon vendor documents
Intel publishes the envelope for this processor, and it is worth reading as three numbers rather than one “TDP”.
| Documented value | Figure | What it governs |
|---|---|---|
| Processor base power | 15 W | The long-duration reference point, closely mapped to PL1 |
| Maximum turbo power | 55 W | The burst ceiling, the region PL2 operates in |
| Minimum assured power | 12 W | The floor the platform guarantees |
| Junction maximum | 100 °C | The temperature ceiling, the thermal wall (see the throttling page) |
Two structural facts follow, and they are the whole reason this topic is confusing:
- PL1 and PL2 are power values, not temperatures. They cap performance whether or not the machine is warm.
- Tau is a time constant. It defines how long the burst wall may stay open. Once Tau expires, the firmware must bring power down to PL1 and keep it there for as long as the workload continues.
That is why a mini PC can hold a high clock for the first seconds of a workload and then settle at a lower one with the fan barely audible: the burst ended because the clock ran out, not because the chip got hot.
Power wall versus thermal wall
The two limits produce different measurements, and telling them apart is the entire diagnostic task.
| Signal | Power wall (PL1 / PL2 / Tau) | Thermal wall (throttling) |
|---|---|---|
| Temperature | Flat, and often unremarkable | Rising to, or sitting at, the processor’s limit |
| Clock behaviour | Plateaus early, then holds a steady lower value | Falls further as temperature rises |
| Time to onset | Seconds — tied to the Tau window | Minutes — tied to heat soak |
| Fan response | Little change; there is no extra heat to remove | Ramp up, often audibly |
| Fix direction | Firmware power limits, or the Windows power plan | Placement, dust, fan curve, paste |
A useful shorthand: if the clock dropped within seconds of the workload starting, suspect the power wall. If it dropped after several minutes of the machine getting hot, suspect the thermal wall.
Does a mini PC manufacturer expose these settings?
Sometimes. Where the option exists, third-party tuning guides for this class of hardware place it under an Advanced or CPU Configuration menu, with names that vary by firmware:
| Common label | Meaning |
|---|---|
| Long Duration Power Limit | PL1 — the sustained envelope |
| Short Duration Power Limit | PL2 — the burst ceiling |
| CPU Power Time Window / Tau | How long the burst is permitted |
| Performance Mode / Unlock | A preset that moves several limits together |
| cTDP (AMD platforms) | The AMD equivalent, exposed differently |
A third-party teardown of the EQi12 series (i3-1220P variant) reported a default package-power figure around 35 W, and a separate tuning guide for a Beelink mini PC describes taking PL1 from 28 W down to 20 W and PL2 from 64 W down to 45 W on an N-series machine for a meaningful thermal gain at a small real-world cost. Those are different processors from our unit, cited as reports about this family of hardware rather than as measurements of the machine on our bench.
Be aware of a trap before you go looking: many compact mini PC firmware builds do not expose power limits at all. If the menu is absent, it is absent — the values are fixed, and the remaining levers are the operating-system power plan and the workload itself.
The trade-off, honestly
Changing a power limit is not free performance. The arithmetic is simple:
| Change | Gains | Costs |
|---|---|---|
| Raise PL1 / PL2 | Higher sustained clock, shorter workloads | More heat and noise; on a small chassis the processor reaches the thermal limit sooner, so the extra ceiling can become a shorter burst rather than more through-put |
| Lower PL1 / PL2 | Lower temperature, quieter fan, more thermal margin | Proportionally lower sustained performance, and on a light home server that cost is usually unobservable |
| Extend Tau | Longer burst window | A longer period of high heat and noise, with no change to the sustained envelope |
For an always-on home server running light services, the honest recommendation from the measured evidence on this page is modest: this machine already draws 12-14 W at idle and 37 W at the wall under sustained all-core load. There is not much power to recover. Lowering a limit is defensible if the machine is in a living space and the fan is the complaint. Raising one is only defensible with a temperature reading and a matched workload to prove the result is real.
If the firmware exposes nothing
- Check the Windows power plan first. High Performance keeps clocks high; Balanced allows the processor to scale down. Switching plans changes sustained power without touching firmware, and it is fully reversible.
- Cap the maximum processor state. Power Options → advanced → Processor power management → Maximum processor state, set to 99 % on mains, prevents the highest boost states without disabling the feature. Measure before and after; do not assume.
- Reduce the workload instead of the limit. Spreading backups and indexing jobs across the day changes sustained power more than any single firmware value, and it costs nothing.
Whatever you change, change one value at a time and re-measure the same workload. A performance claim without a matched workload before and after is not a result.
Where to go next
- Mini PC thermal throttling on a home server — the thermal wall this page is contrasted against, and how to collect the evidence that separates them.
- Mini PC fan policy in BIOS — the fan curve, the other half of the heat-and-noise equation.
- EQi12 seven measured power states — every wall reading quoted above, with the method and its limits.
- Home server power cost calculator — turn a sustained draw into an annual cost using your own tariff.
- Home server power cost guide — the calculation method, with worked examples across server types.
Sources
Measured on our unit
- Beelink EQi12 (i3-1215U, BIOS EQI12D405) — seven whole-system wall-power readings: startup 23 W, Windows idle 14 W, Docker idle 12 W, sustained all-core CPU load 37 W, Jellyfin QSV 13 W, S3 sleep 1 W, shutdown 1 W. Measured with a physical meter between AC power and the unit. Source:
/lab/beelink-eqi12-power-consumption/. - No PL1 or PL2 value is published for our unit, and no before-and-after adjustment was performed. Package power was not instrumented.
Manufacturer and vendor documentation
- Intel Core i3-1215U product specification — processor base power 15 W, maximum turbo power 55 W, minimum assured power 12 W, 100 °C junction maximum. Source: Intel ARK.
- Intel Community processor forum — PL1 and PL2 configuration guidance for the Alder Lake-N class, including Intel’s position that PL1 should follow the processor’s rated power while PL2 must be based on the machine’s own thermal and power capability, and that the vendor should be consulted for the specific system. Used here for the general framework, not for values applied to our unit.
Third-party tuning guides and teardowns (reported, not measured here)
- Teardown of the EQi12 series, i3-1220P variant — reported default package-power figure around 35 W and a default throttle threshold near 85 °C. Different processor from our unit.
- Atem Cooler — mini PC cooling notes, including a worked example of lowering PL1 and PL2 on a Beelink N-series machine and the warning that opening the unit may void the warranty.
- Hystou — “Mini PC BIOS Tuning Guide: Power Walls, PL1/PL2, PBO and Thermal Management” (definitions of PL1 as the sustained envelope, PL2 as the burst ceiling typically 1.5-2× PL1, and Tau as the time constant; BIOS menu paths; the warning that raising limits beyond the platform’s power delivery can produce instability).
- Position Is Everything — Intel power-limit behaviour under sustained load, including the point that a lower wattage reading can indicate a thermally constrained machine rather than an efficient one, and that lower limits such as 25-30 W are a legitimate choice for the quietest behaviour.
- How-To Geek — mini PC BIOS settings review (power limits framed as the setting to check when a mini PC feels slower than its specification).
All thresholds attributed to a different processor model are labelled as third-party reports. Our own figures are wall-power measurements and are not presented as PL1, PL2 or package-power values.